Climate & Carbon‑Aware Planner
A household scheduler that scores every 30-minute slot over 48 hours on carbon, price, weather and comfort — and puts a real number on every recommendation — kg CO₂ everywhere, £ saved where a live price feed exists. Grid carbon intensity swings by a factor of about seven through the day; timing alone can cut a wash-and-dry cycle from ~1.6 kg to ~0.2 kg CO₂
- Problem — UK grid carbon varies several-fold through the day (~50 to ~380 gCO₂/kWh), yet no tool turns carbon, price and weather into a household schedule
- Insight — Timing alone, same appliance and load, cuts one wash-and-dry cycle from ~1.6 kg to ~0.2 kg CO₂
- Solution — I solo-built a planner scoring every 30-min slot over 48 h on carbon, price, weather and comfort, naming windows with kg CO₂ savings in 3 cities and £ savings in the UK
- Outcome — Live at greenhours.ontwrpn.com: 6-month build, 5 free feeds, 30 passing tests, ~£184/yr and ~68 kg CO₂/yr modelled for a London household that follows the windows
Standard carbon advice focuses on what to buy. Nobody talks about when to use it
On a winter evening the UK grid runs at ~380 gCO₂/kWh. At 3 am on a windy Sunday it drops to ~50 gCO₂/kWh — several-fold lower. Most households treat both slots as identical. A 4.2 kWh wash-and-dry cycle at the evening peak emits about 1.6 kg CO₂. The same cycle run at a clean overnight trough emits about 0.2 kg CO₂. That 1.4 kg difference comes from timing alone — same appliance, same load, same energy, just a different hour.
I reviewed eight tools before writing a line of code. National Grid ESO shows carbon intensity but has no price or scheduling. Octopus shows Agile prices but no carbon signal. Loop is historical only. Home Assistant requires hardware and technical setup. The gap: across the eight, none fuses carbon × price × weather × comfort into a named time window with a savings number — supplier-agnostic, hardware-free.
The gap is not awareness — people know the grid varies. The gap is translation: a named window, a real £ figure, a real kg CO₂ number, no setup required
greenhours.ontwrpn.com — the 48-hour slot grid and planner workspace
Four weeks of research, no code — data sources, task profiling, scoring model design
November 2025 was research-only. Week 1: competitive audit of 8 tools and grid data source evaluation. Week 2: carbon API testing across UK, France and Belgium and data quality checks. Week 3: appliance energy profiling — real kWh draws for laundry, dishwasher, EV charging, ventilation. Week 4: scoring model design and architecture decisions.
Data source selection shaped the whole architecture. The UK Carbon Intensity API provides a 48-hour regional forecast — the only free source with genuine forward-looking carbon data at 30-minute regional granularity. France (RTE éco2mix via ODRE) and Belgium (Elia ods192) publish actuals only, so I built a cyclical time-of-day proxy for their forward windows. Electricity Maps covers 50+ countries at 15-minute resolution but sits behind a paid tier. Open-Meteo handles weather for all three cities, free, no key required.
When I integrated real Elia ods192 data for Belgium, the mean carbon intensity dropped from ~165 to ~87 gCO₂/kWh — nearly half. The original model was not just imprecise: it was systematically wrong about a grid that is ~40% nuclear
A 4-axis scoring engine, a slide-window scheduler, and swappable data providers
The stack is deliberately minimal: FastAPI + Python backend, React + Vite frontend, pandas for the slot grid, SQLAlchemy over SQLite locally and Postgres in production. No message queue, no worker processes, no vector database. Planning requests complete in a few hundred milliseconds; the optional Groq AI weekly brief adds ~1.5 s for a single LLM call.
A single 0–100 composite score per 30-minute slot per task, user-weighted by mode. Green mode: carbon 55%, price 10%, weather 35%. Save Money: carbon 10%, price 55%, weather 35%. Balanced: 33/33/34. Comfort is a hard gate — not a weighted axis. A slot that violates a constraint (rain during outdoor laundry drying) is excluded entirely, not just penalised. Recommendations are never absurd. The slide-window scheduler tests every valid start in the 48-hour grid, applies comfort gates, and returns a primary window plus a non-overlapping backup. The search space is tiny — ≤192 slots × 5 tasks = 960 lookups per request — so an exact scan is faster and more auditable than a solver.
FastAPI’s async routes fan out the 3–5 upstream API calls per request concurrently with asyncio.gather. A synchronous framework would serialise them, adding ~1.5–2 s per request. pandas handles resampling (Elia’s hourly data to 30-minute resolution in two lines) and vectorised scoring across 192 slots. Trade-off: ~40 MB added to the Docker image.
Named windows, real numbers, three cities — no hardware, no account required
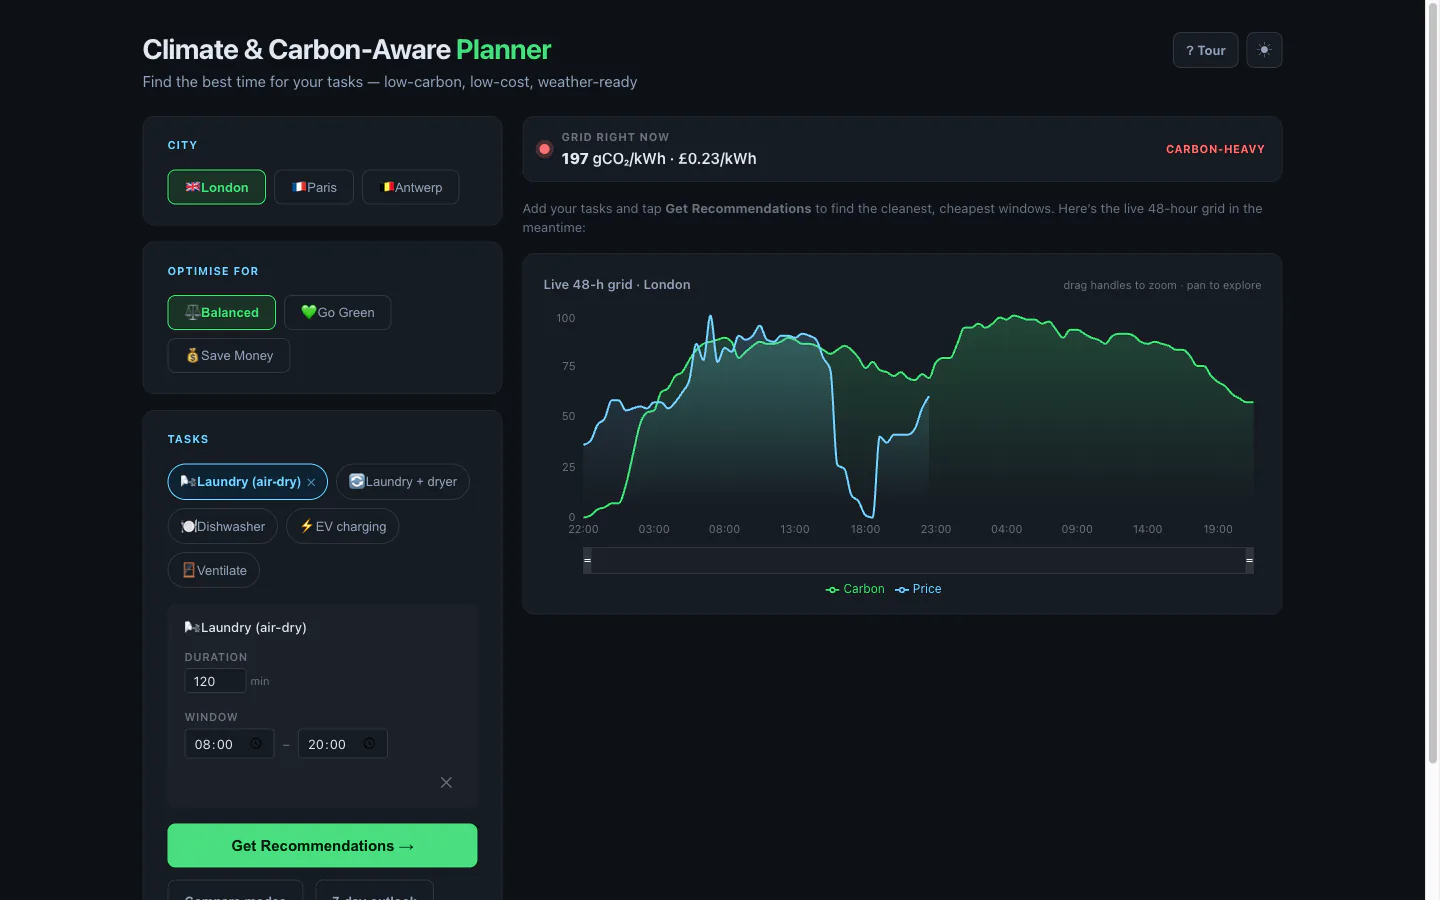
Live — select a city, pick a task, and see the recommended window with £ and kg CO₂ saved
Recommendation cards with shaded recommended-window bands on the 48-hour grid
7-day outlook with Groq-generated weekly brief
Mode comparison: Balanced vs Go Green vs Save Money
Cost savings are UK-only: they come from Octopus Agile half-hourly prices, and France and Belgium have no equivalent free public price feed. The UI labels currency per city (£ vs €) so a figure is never misattributed. The overnight EV scheduler required two fixes — a naïve same-day constraint rejected post-midnight starts entirely, and a later code review surfaced a subtler bug that silently dropped the cleanest small-hours slots. The real fix gates on an absolute window-open instant, backed by a regression test. A reminder that “works on the happy path” and “is correct” are different claims.
Estimated ~£184/yr and ~68 kg CO₂/yr per London household following recommendations
Calculated from live grid data against a defined baseline (UK evening peak, 17:00–20:00). Assumes a single London household following recommendations consistently. EV charging (smart vs plug-in-and-forget): ~36 kg CO₂/yr saved. Laundry air-dry (avoided dryer, 52 washes): ~32 kg CO₂/yr saved. EV cost saving (Agile overnight vs evening): ~£125/yr. Laundry cost saving (Agile off-peak vs peak): ~£59/yr. At 1,000 UK households following EV + laundry recommendations: ~68 tonnes CO₂/yr — equivalent to removing roughly 15 cars from the road.
What I’d do differently: start with Neon rather than Render Postgres (the 90-day deletion policy is a trap I walked into mid-project). Instrument before optimising — the engine has no telemetry on whether users follow the recommended windows; even a binary “did you follow this?” would close the feedback loop. Make the baseline explicit in the UI: a user already scheduling at midday sees a smaller saving and might distrust the number. And revisit the mode toggle as a UX problem — a user who picks Balanced at 09:00 might want Green at 22:00 when overnight charging is essentially free.
Build facts: 6 months, solo, research through deployment. 3 cities (London, Paris, Antwerp) with live carbon data. 5 task types. 5 live data sources, all free-tier. 30 unit tests, all passing. Self-hosted on Coolify (own VPS); £0 data costs.
Sources
- National Energy System Operator — UK Carbon Intensity API (regional 48-hour forecast).
- Sukprasert et al. (2024). On the limitations of carbon-aware temporal and spatial workload shifting. ACM e-Energy. — real savings depend on marginal vs average grid emissions