True Cost of Flying
Every jet tracker shows fuel CO₂ — and across aviation, CO₂ is only about a third of the warming. True Cost of Flying shows the same private-jet flight with its contrail warming added, computed with real physics (the CoCiP model) and drawn on a map where it actually formed: fuel CO₂ vs combined CO₂e, side by side
- Problem — Every jet tracker shows only fuel CO₂ — and across aviation CO₂ is roughly a third of the warming. Contrails, the larger non-CO₂ share, are counted by no consumer tool per flight
- Insight — Contrail warming is flight-specific, not a flat multiplier — the same route can cool by day and warm by night, so it has to be computed with real physics
- Solution — Solo build: an offline Python pipeline (CoCiP · ERA5 · OpenAP) precomputes 84 flights from 11 public-figure jets; a static React + deck.gl front-end shows fuel CO₂ vs combined CO₂e on a map
- Outcome — Live at contrails.ontwrpn.com — no backend, hosts for about £0; validated against published science (matches Contrails.org’s conversion factor to 0.8%), uncertainty disclosed on screen
CO₂ is only a third of the story — contrails are the missing piece
The climate story everyone tells about flying is CO₂. But across aviation, CO₂ is only about a third of the warming; the larger share is non-CO₂ effects, dominated by contrails — the white lines behind jets that spread into heat-trapping cirrus. Contrail-cirrus alone has a larger effective radiative forcing than all the CO₂ from jet fuel, yet no consumer tracker counts it per flight.
The market splits cleanly and nobody sits in the middle. Celebrity jet trackers rank owners on a flat CO₂-per-type table. Contrails.org ranks commercial flights by contrail CO₂e, but only by route and only inside a forecast window. Academic CoCiP studies apply the physics to private jets, but leave it in static PDFs with CO₂ and contrails kept separate. The gap I aimed at: fuse fuel CO₂ and flight-specific contrail CO₂e into one number, per owner, for private jets — and make the result legible and credible to a non-specialist.
The honest answer to “how bad was that flight, really?” is bigger than the CO₂ on every calculator — but the missing piece is invisible, intermittent and genuinely hard to compute
Three surfaces on one scrolled page — “the contrail is the page”
The product is three surfaces tied together by one idea I committed to — the contrail is the page. A leaderboard ranks the 11 owners by combined warming (fuel + contrails) as a dark bento grid with warming-stripe magnitude bars. An explorer lets you pick a famous flyer, then one of their flights, for the two-number reveal: fuel CO₂ vs combined CO₂e, counted up, with a GWP100 / GWP20 toggle whose motion is the teaching moment — one flyer’s contrails jump from +90 t to +332 t as you switch the time horizon.
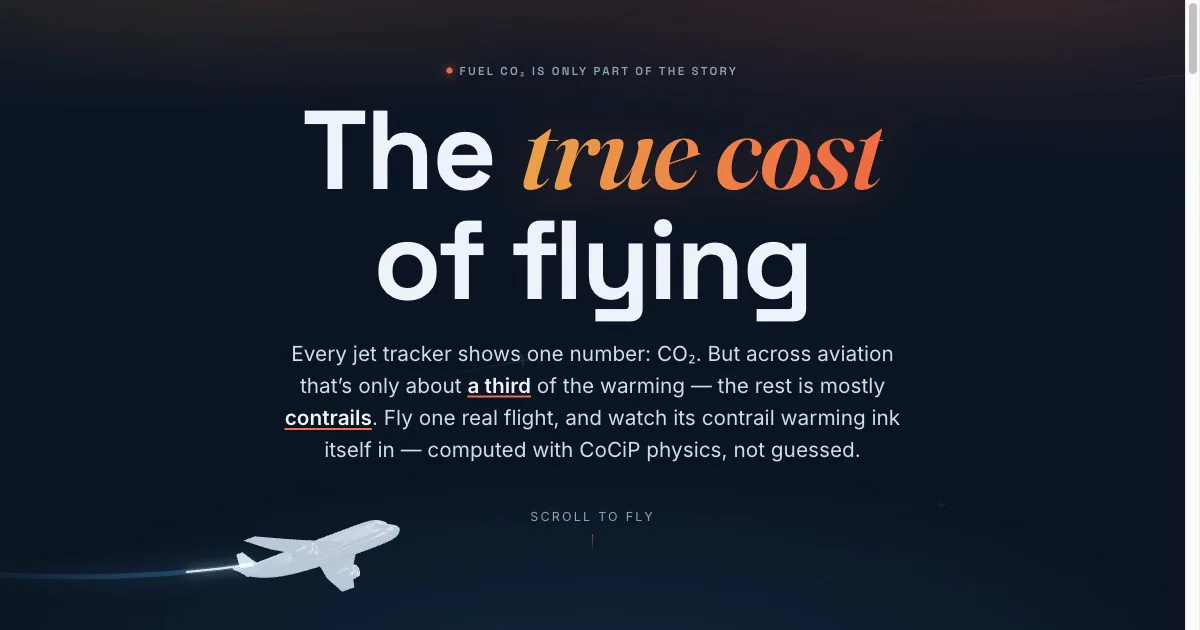
The map is the thesis made visible: a deck.gl TripsLayer inks the contrail along the real flight track — amber for the fuel-CO₂ baseline, red over the ice-supersaturated band where the uncounted warming forms, blue where it cools — with a soft glow blooming over the track as the plane crosses it. Above all three, the hero pins the page and the scroll position itself flies a frosted-glass 3D jet across the viewport, inking the contrail behind it. “Scroll to fly” is literal.
The hero — scrolling flies a frosted-glass 3D jet across the screen, inking the contrail behind it. “Scroll to fly” is literal
The map — the contrail inked along the real flight track; red over the one band where the warming actually formed. The colour is the thesis
Leaderboard — 11 owners ranked by combined warming (fuel + contrails)
The explorer — the two-number reveal, with a GWP100 / GWP20 horizon toggle
Split the system — heavy offline physics, a read-only renderer
The whole project rests on one architectural decision: two strictly-separated halves. An offline Python pipeline turns adsb.lol tracks into CO₂ (OpenAP) and contrail CO₂e (ERA5 meteorology + pycontrails’ CoCiP model), emitting a small static parquet plus per-flight GeoJSON. A single flight loads roughly 1 GB of whole-globe weather, so this cannot run on a free host — it runs once, offline. The front-end is then a pure renderer: a static React + Vite + TypeScript + deck.gl SPA with no backend and no API keys, so it deploys as one tiny nginx container and costs about £0 to run.
Splitting the heavy physics from a read-only renderer is the binding choice — it’s why a physics-heavy idea ships on free hosting
Never a bare number — honesty enforced by construction
Replacing a flat multiplier with an opaque model invites the obvious objection — why trust it? — so honesty is enforced everywhere. The combined figure is fuel CO₂ plus contrails only; the omitted terms (NOx, water vapour, aerosols) are disclosed, so it is never dressed up as the aviation-wide ~3×. The number never appears bare: a GWP100 / GWP20 horizon toggle and an uncertainty band sit beside it, because the IPCC deliberately picks no single metric.
And the two numbers aren’t equally certain — fuel CO₂ is high-confidence, contrails carry roughly 70% uncertainty (IPCC “low confidence”), and that is stated on screen. Net-cooling flights are caveated, because CO₂ warms for centuries while contrail cooling is a one-off, so a net-negative figure never reads as “climate-positive”. On a tiny-fuel flight where contrails dwarf fuel, the product headlines absolute tonnes, not a misleading percentage.
Does the model agree with science it was never fitted to?
It reproduces results it was never tuned on. Formation incidence lands in the same order of magnitude as Teoh et al. 2024’s fleet statistics. Day versus night controls the sign: Drake’s 767 flew the same Toronto–Houston route by day (net-cooled −10 t) and by night (warmed +1.6 t) — opposite sign, identical route. A deep-night flight added +90 t of contrail warming, about 2.4× that flight’s own fuel, while six of the same jet’s other flights formed almost none. The EF→CO₂e conversion matches Contrails.org’s own published factor to 0.8%.
Where the model diverges I say so, and which way — every systematic bias pushes the figure down, so the tool errs toward under-stating, the conservative direction for an accountability claim
A scroll-flown 3D hero, without the 3D tax
The frosted-glass jet is a CC-BY low-poly model (attributed in the footer), smoothed at load with Loop subdivision; an orthographic camera scaled in pixels keeps the glass material physically stable and removes edge-of-screen perspective skew; phones get a straighter climb and a smaller jet, and prefers-reduced-motion — or any WebGL failure — falls back silently to an SVG glyph. The whole three.js scene ships as a lazy ~156 KB-gzip chunk off the hero’s critical path, and the ~400 KB map stack is lazy-loaded too, so critical-path JS dropped from ~457 KB to ~59 KB gzip and the hero paints fast.
Two reviews hardened it. An adversarial multi-agent pass across data/honesty, accessibility, performance and deployment caught a real framing crack — a net-cooling flight showing a bare −154%. A follow-up security audit added HSTS, a strict Content-Security-Policy (script-src ’self’, no inline scripts), tightened cache-control on static data and assets, and interactive:false on the decorative map for accessibility.
The bar: trusted because the validation holds
The piece succeeds when a reviewer reaches the two-number reveal, watches the contrail draw itself red over the one segment that mattered, toggles the horizon and sees the number move, understands that contrails add roughly 30–60% at GWP100 (and why the aviation-wide figure is ~3×), sees the uncertainty — and trusts the number because the validation holds up against published science.
Live — no backend, hosts for about £0, honest by construction
Sources
- Lee et al. (2021). The contribution of global aviation to anthropogenic climate forcing for 2000 to 2018. Atmospheric Environment 244:117834. — the basis for “CO₂ is only about a third of aviation’s warming”; contrails are the largest non-CO₂ term.
- Schumann (2012). A contrail cirrus prediction model (CoCiP). Geoscientific Model Development 5(3):543–580. — the contrail physics the offline pipeline runs (via pycontrails).
- Contrails.org — Impact Explorer (Google Research / Breakthrough Energy). — independent contrail-CO₂e reference the project validates its conversion factor against (to 0.8%).