Axonis
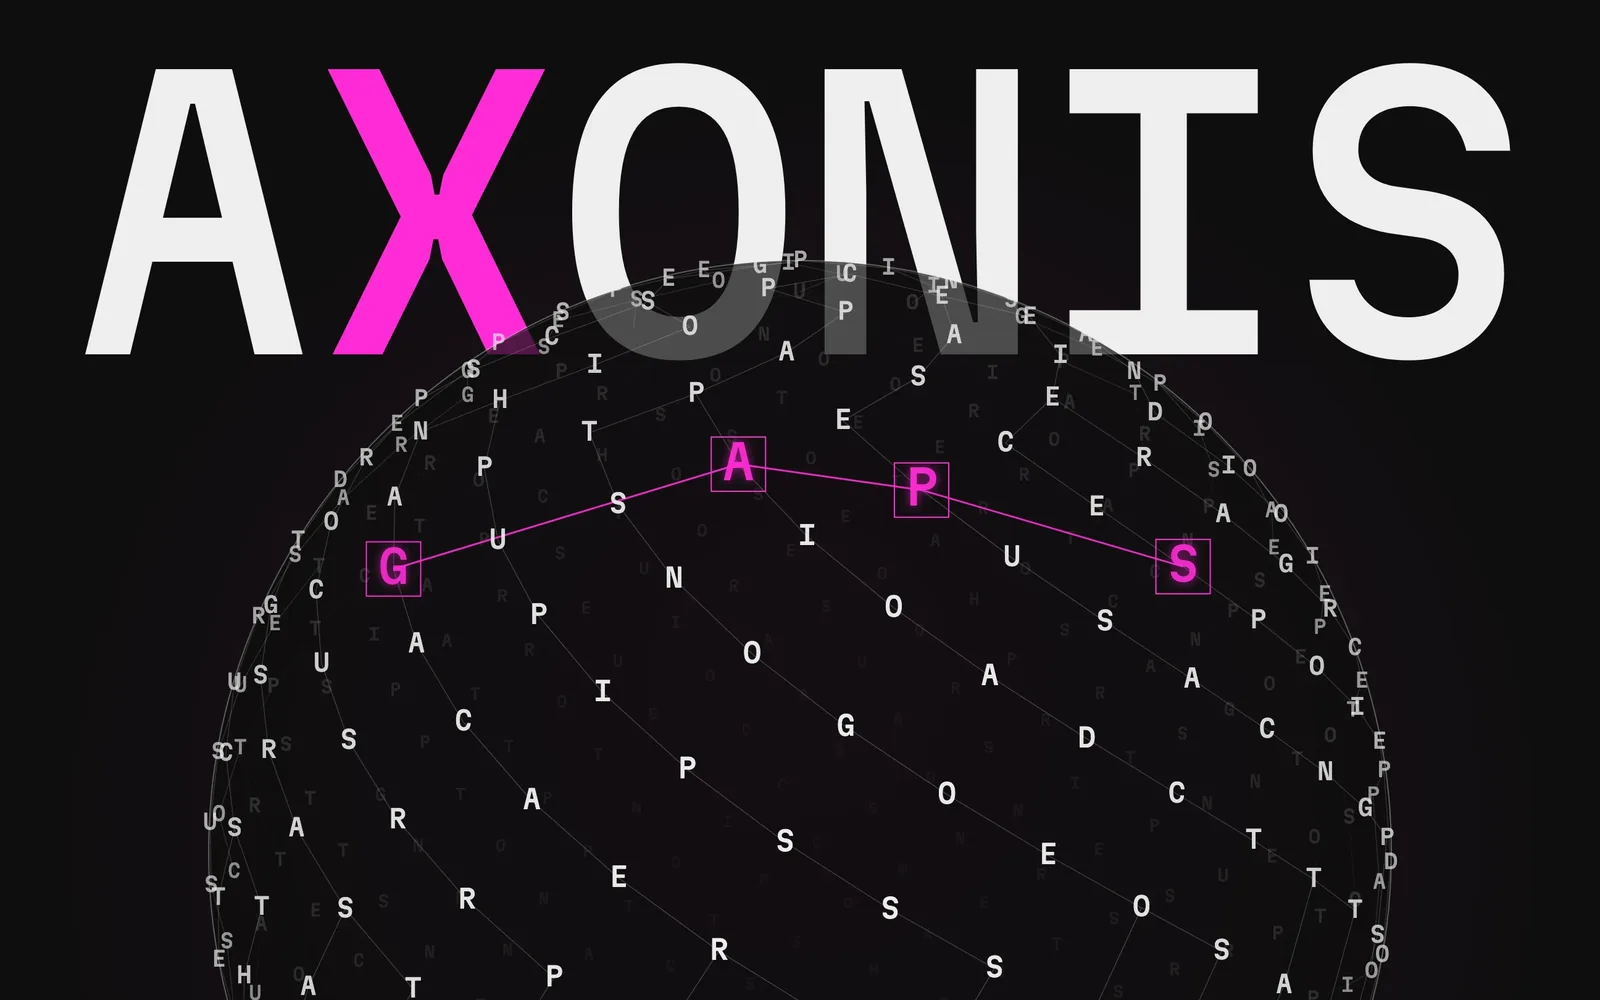
Type any domain — AI tutoring, CSRD reporting, e-waste circularity — and get an interactive knowledge graph of its concepts, research clusters and product-opportunity areas, built from open data in under a minute. Built solo Nov 2025 – May 2026, then redesigned and renamed Axonis in October 2026; 254 automated tests, WCAG 2.2 AA, €0/month
- Problem
- Day-one domain orientation costs PMs hours of scattered search; the open data exists, but no tool assembles it into a map
- Insight
- The missing layer isn’t visualisation but opportunity reasoning — scoring clusters where research is dense and products scarce
- Solution
- I built (solo, end-to-end) a tool that turns Wikidata + OpenAlex into an interactive graph, scored opportunity cards and a brief in under a minute
- Outcome
- Live at axonis.app; 254 automated tests, WCAG 2.2 AA, €0/month — portfolio project, no external users yet
Every new initiative starts with the same unstructured slog
Day-one orientation in an unfamiliar domain costs PMs and researchers hours of scattered search. The data needed to answer ‘what is this space made of?’ already exists in open, freely-licensed datasets — Wikidata and OpenAlex — but no tool assembles it into something you can navigate. Prose AI assistants answer in paragraphs; you can’t spot a cluster, or see where nobody is working, in a paragraph.
The missing layer is not visualisation — that’s table stakes. It’s opportunity reasoning: scoring clusters where research is dense and products are scarce
The entry point: open a ready demo map and see a gap in seconds, or type a topic and the pipeline starts in the background. The sphere of letters on the right can be dragged and spun
Fourteen tools surveyed; none reasons about opportunity
As a self-directed project, discovery was a structured competitive-landscape study plus dogfooding — not a programme of external user interviews, and this case is explicit about that. I surveyed fourteen tools across four categories (paper-citation graphs, AI research assistants, note/relationship-graph apps and market-intelligence platforms) and scored each against five capabilities: automatic open-data ingestion, entity-relationship graphing, opportunity detection, structured output and AI synthesis.
The pattern was consistent: paper-graph tools (Connected Papers, ResearchRabbit) have the graph but only over publications, and do no opportunity reasoning. AI assistants (Elicit, Consensus, Perplexity) synthesise into cited prose — strong output, no navigable entity graph. Note-graph canvases (Obsidian, Roam, Kumu) graph beautifully but require you to author every node yourself, which is useless on day one of a new domain. Market-intel platforms (Crayon, Klue) track competitors, not concept domains. None of the fourteen combined all three of automatic open-data ingestion + a true entity-relationship graph + product-opportunity reasoning.
Orient → find structure → spot openings → hand off
The backend runs a nine-step pipeline on demand: Groq expands the topic into ~8 search terms; Wikidata and OpenAlex are queried in parallel; rapidfuzz de-duplicates entities at a similarity threshold of 88; NetworkX computes degree and betweenness centrality; Louvain community detection groups nodes into clusters; an opportunity-scoring model weights size, research density, product gap and bridge potential; Groq writes narrative opportunity cards for the top 5 clusters with a deterministic template fallback. Papers are chosen by relevance first and citations second, one model call screens out namesakes before they enter the graph, and the institutions of their authors join as the actors behind the research. Every node carries a one-line description from OpenAlex or Wikidata. While it runs, the build screen shows the real stage, the counts and a timestamped log as the server reports them, then draws the saved graph before the AI cards are finished.
The four post-graph views map exactly to the exploration workflow: the physics-based graph for orientation (drag any node, the whole graph responds), Clusters for finding structure (Louvain communities ranked by opportunity score), Opportunities for spotting openings (cards with risk badges, why-it-matters, an evidence bar and a breakdown of how the score adds up), and a one-click Research Brief for handing off — rendered HTML, downloadable .md, printable to PDF. Ask the map answers questions about the domain with inline [n] citations; hovering one lights its node on the graph.

Live — type any domain and explore the graph
Clusters
Opportunities
Research Brief
Mobile bottom-sheet
Axonis: one accent, real progress, a graph you can question
In October 2026 the product got its own name and domain, Axonis, and a new design system. I made eight concepts from a 162-image moodboard and chose one: dark, a single magenta accent, Martian Mono with Mona Sans, square bracketed controls. The spacing comes from one measured reference, the Railway app: its ladder of 8, 16, 24, 32 and 48, a 54 px top bar and a 360 px inspector. Every element was traced to a reference before it was drawn, and the Figma library is built as atoms, molecules and organisms.
The redesign also fixed something the old build was quietly doing wrong. Its build checklist advanced on a 3.8-second timer, so it could tick a step before the server had reached it. The server now reports its real stage, counts and events, and the screen shows only those. When nothing has been reported, the steps are labelled as the typical order, with no ticks.
Every tick, count and log line comes from the server. The preview starts only after the new entities are saved, so a rebuild never shows the old map
⌘K: jump to any node or run an action
Ask: [n] citations are tied to nodes
The graph became something you can question rather than just look at. A TYPES chip opens the legend that filters types, a Depth control shows only the one or two hops around a node, the selected node’s edges light up, and labels are capped at its eight best-connected neighbours. A List view mirrors the canvas as a sortable table, so the map also works with a keyboard and a screen reader.
The list view is the accessible mirror of the canvas: sortable, filterable, and each name opens the node in the inspector
One accent, measured spacing and dense-graph readability
B² is dark by definition: four greys, one text colour and one magenta accent, which marks selection, citations and live state and nothing else. Body text clears AA on every surface. The darkest grey fails as text, so a written rule keeps it for decorative and inactive elements only. Radius is zero everywhere. On a phone the side panel becomes a bottom sheet, and every control gets a 44 px target.
Dense-graph readability needed its own fixes. Node shape encodes type, so colour stays free for state. Labels sit on plates so edges never cross the letters, only the three biggest hubs are bright, and highlight fits stop at 1.2× zoom so a handful of nodes never become billboards. The two-phase cola layout keeps every node in live physics, so the graph answers any drag.
Dependency-free spotlight tour: opens from the Tour button or ⌘K, keyboard-operable and prefers-reduced-motion aware. It no longer starts by itself: the first look at a map belongs to the gaps
A structured review caught two production bugs before users could
Before declaring MVP done I ran a structured code review. It found two genuine production bugs: DELETE /projects/{id} removed entities and relationships but not clusters/opportunities, causing a foreign-key violation that broke delete on production Postgres; and a stored XSS in the brief Print window where LLM-generated Markdown and the user-derived filename were written via document.write with only < escaped. Both fixed and locked behind tests.
The automated suite runs against a throwaway SQLite database with AI disabled — it never touches the production database or Groq. 167 pytest tests cover project CRUD, brief gating, the delete-cascade regression, the model fallback, build progress, citations, the score breakdown, demo protection, rate limiting, owner tokens, the daily AI budget, input and request-size limits, uploads, the relevance screen, cluster names, node descriptions, real 404s and caching, and the per-demo link previews. 87 Vitest / Testing Library tests cover the state screens and toasts, the Ask panel and its citations, the command palette, the list view, the gap cards, the tour, the phone sheet, owner tokens, analytics consent and safe brief rendering. All 254 pass, in CI on every pull request.
The review paid for itself on the delete bug alone — silently broken in production, and a bug no manual click-through had caught
Reviews kept paying off after the redesign. With no accounts, anyone could delete or rebuild the demo maps, so those are now read-only and the costly actions are rate-limited per IP. A security review of that limiter found it trusted the first X-Forwarded-For entry, which the client controls, so a forged header could bypass it. It now reads the address the proxy appended, and its memory is bounded.
A second round in October went after what the demo maps actually showed. A map about solar land scouting carried a Mars rover cluster, and one about longevity carried star clusters: OpenAlex matched single words, and each namesake paper pulled its topics and institutions in with it. One model call now screens the papers, with each paper’s research field shown to it, before anything enters the graph, and the rebuilt maps had no off-topic clusters left. Prompts stopped being tuned by eye: hand-labelled sets of 89 candidate papers and 62 real clusters score every prompt change, and the share of cluster names built only from words in their members rose from about 0.6 to about 0.9. The same pass made maps from before owner tokens read-only, moved the daily AI budget into the database and fixed Ask answering in English when the question was not.
First look: the top gaps light up on their own, once per session
Even the 404 is a gap on the map
AI that enriches but is never load-bearing
The easy version of this case would describe a discovery programme with external user interviews. There wasn’t one. Inventing it would fail the first interview question, so the case says plainly what discovery actually was: a structured competitive-landscape study plus dogfooding. That work produced the real positioning — paper-graph tools have the graph but only over publications and do no opportunity reasoning, while market-intel platforms track competitors rather than concept domains. Visualisation is table stakes, so the effort went into the scoring layer.
The architectural decision I would defend hardest is that AI is never load-bearing. Every Groq call has a deterministic fallback, and the product is fully functional with no Groq key at all. In a portfolio full of LLM features this is the unfashionable choice. It costs a second code path for every enriched field, and it means a free-tier outage degrades the product instead of breaking it.
In October 2026 that decision was tested for real. Groq retired the model the app called, and every AI feature fell back to templates. The product kept working, which was the point. It also hid the outage, which was not: nothing failed loudly until a rebuild’s logs showed a wall of 404s. Graceful degradation needs a signal. Calls now go through one module that walks a list of models, treats an empty answer as a failure and logs every fallback.
Writing the test suite after the pipeline rather than alongside it was a mistake with a receipt. The suite eventually found two genuine production bugs: a delete that removed entities and relationships but not clusters, causing a foreign-key violation on production Postgres, and a stored XSS in the brief print window where LLM-generated Markdown and a user-derived filename were written with only angle brackets escaped. The delete bug lived for several commits. The tests came too late to catch it sooner.
Live, hardened, free — and honest about what is still unvalidated
Live at axonis.app. First shipped in June 2026 and redesigned in October. Built solo in seven months alongside other work. Stack is deliberately boring and free: Wikidata + OpenAlex for data (€0), Groq free tier for AI (€0), networkx + python-louvain for graph and metrics (€0), FastAPI + SQLAlchemy 2.0 backend, React + Vite + Cytoscape.js frontend, Docker → Coolify on self-hosted Hetzner (€0 marginal). Every Groq call has a deterministic fallback — AI enriches but is never load-bearing; the product is fully functional with no Groq key.
What I would do differently: write tests alongside the pipeline rather than after (the delete-cascade bug lived for several commits), cap graph nodes earlier for dense topics (layout tuning came after the fact), and name the batch-vs-on-demand trade-off up front so the polling UX gets shaped sooner. The honest read on opportunity scoring: it reliably produces a plausible first map, but whether the scored openings are right needs real PMs reacting to them — that is the next priority, ahead of more features.
The map: shape encodes type, the selected node lights its edges, and the inspector shows its metrics and connections
Sources
- Blondel, Guillaume, Lambiotte & Lefebvre (2008). Fast unfolding of communities in large networks (Louvain). J. Stat. Mech. P10008.
- Freeman (1977). A set of measures of centrality based on betweenness. Sociometry 40(1):35–41.
- Priem, Piwowar & Orr (2022). OpenAlex: a fully open index of scholarly works.
- Vrandečić & Krötzsch (2014). Wikidata: a free collaborative knowledgebase. Communications of the ACM 57(10):78–85.
