Neighbourhood Fit Score
A neighbourhood scoring engine for Brussels EU relocators — 724 statistical sectors, 3 persona scenarios, real walk-network routing, and the layer none of the eight tools I audited has shipped: concrete improvement suggestions showing exactly what single amenity would lift a sector’s score and by how many points
- Problem — 37.2% of Brussels’ 1.25M residents are non-Belgian, choosing among 19 communes with tools that give a number, no reason
- Insight — Rivals race on what score; the open ground is for whom, why, and how to improve — no EU-native tool touches it
- Solution — I built solo a scoring engine over 724 sectors × 3 personas: explains the why, suggests fixes, compares two sectors
- Outcome — MVP live in public beta at cityscore.ontwrpn.com, first 20 users, 2,172 precomputed scores, <5 ms API, €0 LLM cost
A city of arrivals with no useful location intelligence
Brussels is functionally a city of arrivals: 37.2% of its 1.25 million residents are non-Belgian, drawn by EU institutions, NATO, international NGOs, and a growing remote-work diaspora. The European Commission alone employs 21,705 staff, with ~1,900 new Blue Book stagiaires arriving every March and October. These are high-earning, educated, English-default arrivals who face a low-information decision: which of 19 communes is right for their specific life situation — a family with young children, a remote worker who needs cafés, a senior who needs frequent transit and nearby GPs? Existing tools offer no answer to this question. They offer a number.
A competitive audit of 8 tools (Walk Score, Niche, AreaVibes, Local Logic, Rightmove, Novad, mylocationscore, AARP Livability Index) surfaced three structural gaps: every meaningful competitor is US/Canada-centric; scores exist without explanation — a 72/100 tells you nothing about what drove it; and the ‘how to improve’ layer is entirely unoccupied. Not one competitor has shipped ‘add one pharmacy at this location → score lifts by 9 points.’
Competitors race on what score. The unoccupied ground is for whom, why, and how to improve — four verbs the EU location-intelligence market left entirely unaddressed
Open data, real streets — not straight-line distance
The scoring engine is built from four open data sources: 724 Statbel statistical sectors (~100–200 residents each, Belgian census unit), OpenStreetMap Geofabrik Belgium PBF extract across 18 amenity categories, STIB/MIVB GTFS transit feeds with frequency-weighted stops, and UrbIS Brussels GIS layers. The most important decision was routing on real pedestrian streets via an OSMnx walk graph (92,950 nodes, 264,936 edges) rather than straight-line distance — which systematically overestimates access by roughly 20–40%.
Distance decay uses a plateau+Gaussian function: full marks within a threshold time, smooth decay to zero at the maximum, no cliff edge. Transit sub-scores multiply decay by a frequency factor — a stop served every 5 minutes scores full marks; one served every 30 minutes scores proportionally lower but keeps 40% of its decay rather than nothing. The scoring engine ran ~10 minutes on a laptop to precompute all 2,172 scores (724 sectors × 3 scenarios). Runtime API responses are <5 ms — a lookup, not a calculation.
MapLibre GL choropleth over OpenFreeMap (keyless). Yellow markers show where a single new amenity would produce the largest score gain
Explain, switch, improve, compare — the four verbs competitors skipped
Every score comes with a category breakdown, colour-coded strengths and gaps, and — the differentiating layer — concrete improvement suggestions. For each sector × scenario, the engine identifies the top-3 categories where a single additional amenity produces the largest score gain, with a map marker showing the suggested location. Output: ‘+1 pharmacy within 400 m → Senior score 62 → 71 (+9 points).’ Three persona scenarios shipped at launch — Family, Senior, Remote Work — with scenario weights published in the UI as a transparency choice, inviting scrutiny rather than hiding behind a black box.
The ‘Ask’ panel streams a 2–4 sentence answer grounded only in the sector’s own data via Groq (Llama 3.3 70B, free tier) over server-sent events — instructed to use no outside knowledge and avoid demographics. The Compare panel puts two sectors side by side with per-category deltas, a per-row winner, and a plain-English verdict backed by /api/compare. The ‘Find by amenity’ filter lets users multi-select amenity chips (including dog parks) with a minimum-score threshold to highlight matching sectors.
Score panel for Vieille Halle aux Blés (Family scenario, score 86). Every section from the ring through Score Boosters is generated from precomputed data at <5 ms
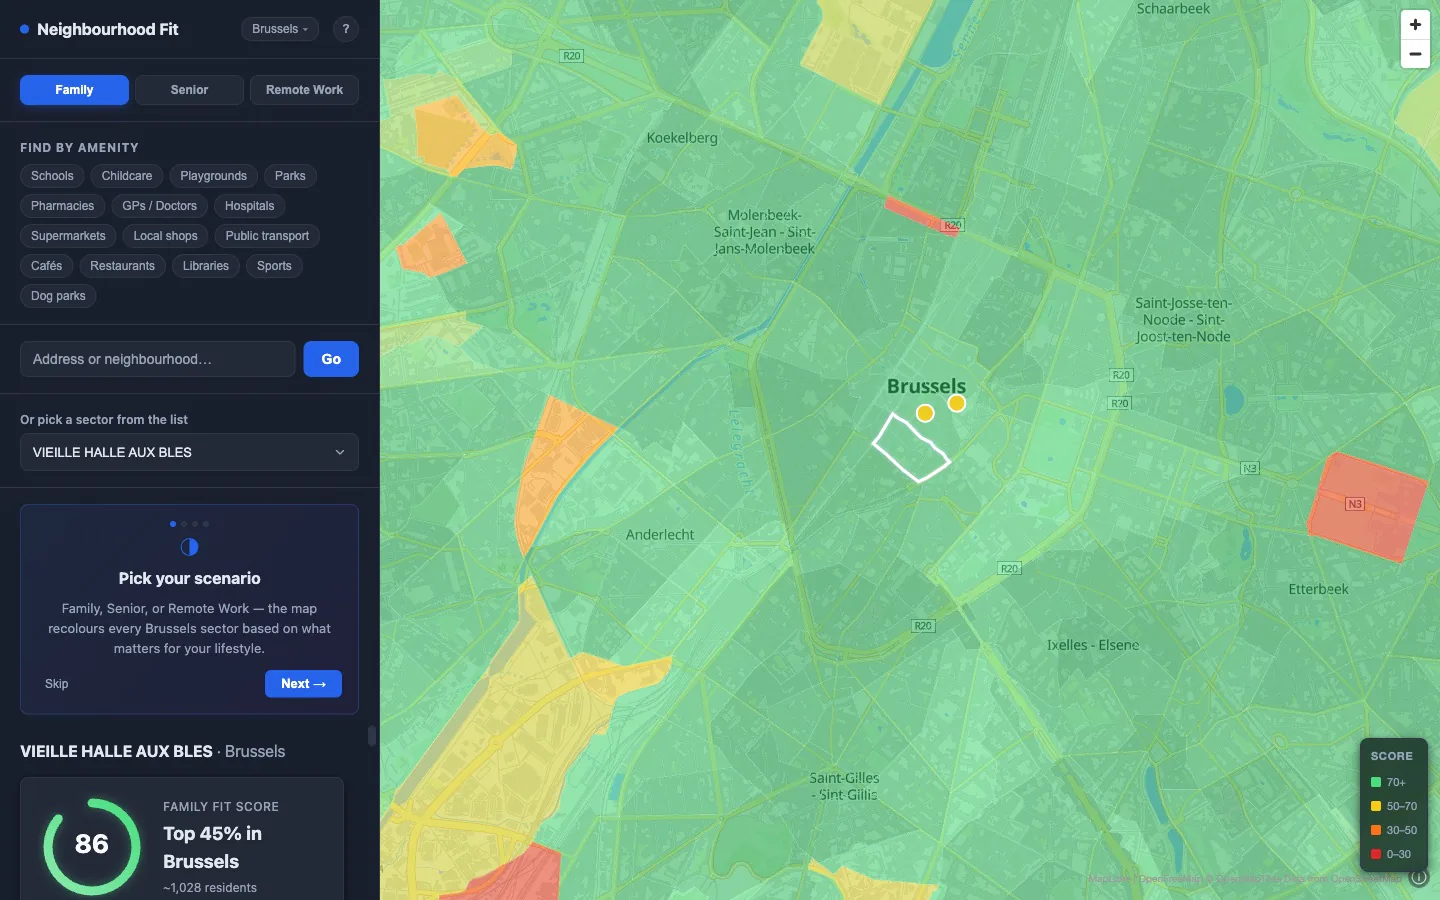
Live beta — search any Brussels address, pick a scenario, explore improvements
The hardest constraint was running heavy geo-compute inside a tight hosting budget
The core architectural insight: separate offline compute from runtime serving. Heavy geo-libraries (osmnx, geopandas, NetworkX Dijkstra) cannot run in a production web server at Render’s free-tier 512 MB RAM ceiling. The solution is a strict two-layer split: an offline pipeline (OSMnx, geopandas, NetworkX, Statbel, STIB GTFS) runs locally or in GitHub Actions monthly to refresh data, serialises 2,172 scores to CSV, and commits them to the repo. The runtime API (FastAPI + shapely + numpy + SQLModel) seeds from that CSV on container boot and answers requests with plain lookups.
Key technical decisions: Python FastAPI over Node Express (geo-libraries are first-class Python; single language across pipeline and runtime); shapely point-in-polygon over PostGIS (724 sectors load entirely in memory — no Postgres extension needed); Statbel statistical sectors over UrbIS neighbourhoods (finer granularity, MAUP-defensible); OpenFreeMap over commercial basemap (no API key, no rate limits, EU-hosted, zero cost); Nominatim geocoding with DB cache (1 req/s rate limit mitigated by aggressive SQLite cache). In June 2026 the app migrated off Render + Supabase to a self-hosted Coolify instance on Hetzner with internal Postgres, removing the 30-day Render Postgres expiry.
pyrosm was the wrong dependency bet — incompatible with Python 3.14 due to a broken pyrobuf build. Pivoting to osmium-tool CLI (C++, no Python-version dependency) cost two days. Lesson: validate geo-dependency compatibility before committing to a parsing strategy
Production hardening, accessibility, and design system in a single pass
The June 2026 hardening sprint covered: gzip + ETag/Cache-Control + in-process cached choropleth; coordinate rounding (−66% payload); slowapi rate limiting on /api/explain and /api/score; CSP + security headers; scenario/category validation (422/400); no error-string leakage; a new /api/weights single-source-of-truth endpoint that removed a scenario-weights table duplicated across the pipeline config, seed script, and frontend. MapLibre split into a long-cached vendor chunk.
WCAG 2.2 AA accessibility pass verified with axe-core (0 violations): keyboard listbox + non-map sector picker, role=alert errors, focus-visible, prefers-reduced-motion, ≥24px touch targets, responsive reflow at 320px. Visual polish — staggered reveals, rAF score count-up, gradient bars/ring — all respecting reduced-motion. Design-system pass replaced ~20 ad-hoc font sizes and uneven section padding with a unified type scale and 4px spacing scale. Two latent bugs fixed: SQLite migration crash and double-seeded map POIs.
MVP shipped, 20 beta users, honest about what a single-city v1 can claim
MVP shipped as a public beta at cityscore.ontwrpn.com. Metrics at launch: 724 Brussels statistical sectors scored, 3 persona scenarios, 2,172 precomputed scores, 4,533 improvement suggestions (up to 3 per sector × scenario), <5 ms API response, <10 MB total DB footprint, €0 marginal hosting on an existing shared Hetzner VPS. First 20 beta users recruited from Brussels expat channels. Antwerp multi-city infrastructure already shipped (city-parameterised pipeline, city column migration) — data pipeline run pending.
What I would do differently: start with the improvement layer. It is the strongest differentiator and it was built in Week 5. Future projects: lead with the thing no-one else does, validate it first. The pyrosm-to-osmium pivot cost two days and could have been caught with a 30-minute dependency compatibility check. The Render Postgres 30-day expiry (not 90 days as assumed) reinforced the lesson: always test recovery, not just deploy — which is why all 2,172 scores are committed to the repo as seed data.
Brussels choropleth with the score panel open. The product live at cityscore.ontwrpn.com
Sources
- Boeing (2019). Street network models and indicators for every urban area in the world; pedestrian circuity typically ≈ 1.18–1.40.
- Giacomin & Levinson (2015). Road network circuity in metropolitan areas. Environment and Planning B 42(6):1040–1053. — real pedestrian routes run ~1.2–1.4× the straight-line distance