noda
A free, open-data tool for building EU research consortia. It turns two public datasets — OpenAlex and CORDIS — into ranked partner shortlists, then carries the coordinator through the rest of the job: the call, the eligibility rules, the gaps, the comparison and the outreach. Formerly Open Science Collaboration Network
- Problem
- Finding EU Horizon consortium partners runs on personal networks and Google: two to four proximity-biased weeks, with no evidence of fit
- Insight
- A raw publication ranking puts Harvard and MIT first for every topic. Weighting EU project history and network position surfaces the institutions that actually join consortia
- Solution
- An open-data platform I built solo, end to end: a 0–100 Partner Fit Score on six signals, a network map, gap analysis against Horizon rules, live calls, compare, a pipeline with outreach drafts, semantic search and AI briefs
- Outcome
- Live as noda at noda.science: 6 topics, 8,400+ scored institutions, 740,000+ collaboration links, €0 a month. WCAG 2.2 AA with 0 axe violations on 24 screens
Horizon Europe partner discovery runs on personal networks — and it shows
EU Horizon Europe grants (€95.5 billion over 2021–2027) almost always require a multi-country consortium of at least three partners. Consortium composition is a scored criterion and a frequent rejection reason. The official tooling — the EU Funding Portal’s Partners Search — returns an unranked name directory with no publication data, no network context and no fit scoring. It has not changed substantially in a decade.
Four semi-structured interviews with researchers who had submitted Horizon proposals produced a consistent workflow: list the organisations the PI already knows from conferences, search Google Scholar for affiliations, check CORDIS by hand, ask mailing lists. Proximity dominates: an organisation outside the PI’s network had almost no chance of making the shortlist, whatever its fit. And consortium gaps — the missing policy body, the absent NGO — were found during writing, when they are expensive to fix.
The problem is not a shortage of data — OpenAlex and CORDIS are public, comprehensive and free. No tool had assembled them into a form that fits how partners are actually found
Partner Shortlist: institutions ranked by Partner Fit Score, filterable by country, type and score
Four pain themes — and one screen that wasn’t in the original spec
Discovery combined four methods: four 45-minute stakeholder interviews, a review of 12 funded Horizon project descriptions on CORDIS, a competitive audit of the EU Funding Portal, ResearchGate and ERAPortal, and a technical spike to check OpenAlex and CORDIS coverage and data quality.
Pain theme 1: discovery is entirely network-dependent. Pain theme 2: there is no quantitative fit signal; partners are chosen on reputation and trust. Pain theme 3: consortium gaps are discovered late, during writing. Pain theme 4: CORDIS is unusable without tooling; all four interviewees knew it existed, none used it regularly.
The Consortium Gap view came straight from pain theme 3. It is the screen that most clearly separates the product from an institution-ranking table
A raw publication ranking surfaces Harvard for every topic — which is not useful
The Partner Fit Score is a 0–100 weighted composite of six signals: topic relevance (30%), publication activity (20%), EU project participation (20%), network centrality (15%), country diversity (10%) and recent activity (5%). Each signal is normalised by percentile rank within the topic’s cohort, not divided by the maximum. That was the first version’s mistake: dividing by the maximum pushed about 86% of institutions below 30 and left one or two above 70 per topic.
Every score is stored with its per-signal breakdown, so a researcher sees exactly why an institution ranked where it did: in the shortlist row’s preview, in the profile’s breakdown bars, and in the score ring, which shows one signal while you point at its row. Below the score, the profile lists the evidence: the institution’s EU projects strictly on the topic, its role in each, the partners it works with most, and a delivery record from CORDIS.
Institution profile: score ring, six-signal breakdown, evidence
Delivery record: outputs of the projects the institution took part in
Matching is deliberately conservative. CORDIS and OpenAlex share no identifier, so organisations are matched by name within a country. A name match of 75–90 now counts only when the Research Organization Registry confirms it; a dry run showed this removes about 56% of participations, many of them universities paired with same-named hospitals. The EU-project counts err low, and the methodology page says so.
From shortlist to consortium
The first version stopped at the shortlist. Coordinators then spend weeks on everything that follows: picking the call, checking the rules, comparing near-equal partners and chasing the ones they contacted. No free tool covers that stretch, so the product grew to cover it, on open data only.
Network map: clusters, centrality, the strongest links
Consortium gaps: roles, the Horizon eligibility rule, countries against funded consortia
Gaps are checked against evidence, not a template. Roles map to ROR organisation types, and the page says that this is indicative. The eligibility check covers the general rule for Research & Innovation Actions: three partners in three Member States or Associated Countries, at least one in an EU Member State. Your countries are compared with the consortia that were actually funded on the topic; for Climate adaptation that is 192 multi-country projects with a median of seven countries. Widening countries are highlighted, because evaluators often welcome them.
Live Horizon calls matched to the topic, each with a deadline banner
Compare 2–4 partners: differences first, identical rows folded
Pipeline: from shortlisted to in, with the admin checklist
Outreach draft built from real evidence, never invented
AI brief: generated in the weekly batch, never at request time
Semantic search over the topic’s works

Live — six research topics, 8,400+ scored institutions, 740,000+ collaboration links
A developer tool becomes a product people trust
The working product looked like a developer tool: a dark navy dashboard with no front door and a name too long to say aloud. The redesign gave it a name, noda, from “node”; a landing page that explains it before asking for a click; and one visual idea: institutions are beads, collaborations are the threads between them. The logo, the graph and the landing illustration all come from it.
I tested five palettes on the same real screens rather than on swatches. The chosen one has a lavender-grey page, ink text, a cobalt accent and a lime highlighter used once per page. Bright fills such as lime and lilac fail 3:1 contrast as graph nodes on a light background, so every node has an ink outline. That only showed up inside the actual graph.
Then a graphic-design audit, because the product passed every automated check and still looked unfinished. Buttons in one row had different heights, icons sat a pixel or two off their labels, two thirds of the text was 11–13 px, and the network map’s labels could not be read. The type floor went up to 13 px for captions and 15 for interface text. Controls in a row now share one height. Icon alignment was measured against the label’s cap height instead of eyeballed: the correction flips sign between running text and buttons. The map shows the 280 strongest links and labels only the 18 most central institutions; labels hide rather than shrink.
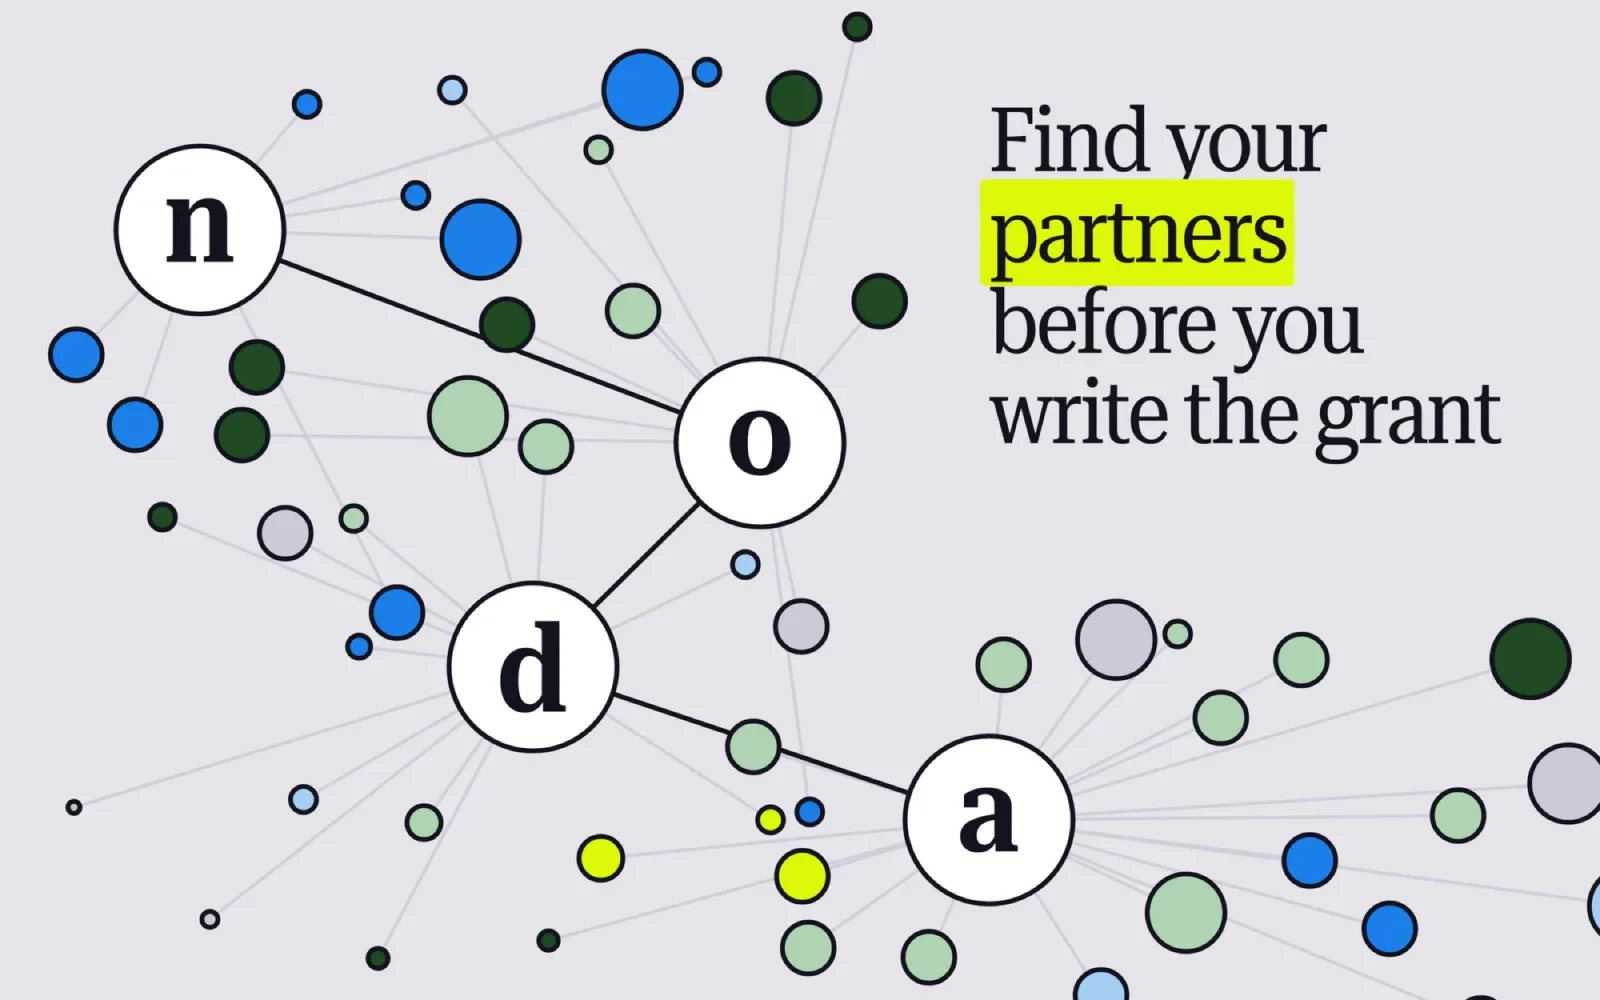
Then motion, and the details that only show up in use. The landing hero is a loop I built in Cavalry: the four hubs are beads lettered n·o·d·a, joined as a consortium, while partner beads slip their threads, drift off and are caught again. It ships as a transparent video, HEVC with alpha for Safari and every iOS browser and VP9 for the rest, with a pause button; it stops off screen and under reduced motion. Short words no longer dangle at a line end: a script binds 256 strings of interface copy, and a small runtime pass does the same for names that arrive from the data, such as “de la Recherche”. And nothing moves on its own any more. Switching tabs used to jump the page 7 px sideways as the scrollbar flickered, two tabs left the shared column, and the hero shifted when the web font arrived. Each was measured, fixed and measured again.
The landing hero, made in Cavalry: n·o·d·a hold while partners come and go
The 404 page got the same idea instead of a stock illustration. Unknown links used to show the landing with a 404 status; now they get their own page, where 4·0·4 hang as a Newton’s cradle of the product’s beads. Every few seconds the outer 4 swings into the 0, the 0’s thread snaps, it drops and rolls, and a thread comes down to reel it back. It is drawn live on a canvas rather than played as a video, so it fills any screen, and visitors can grab a bead and fling it. Nothing ever crosses the text, and under reduced motion it is a still frame with the 0 lying on the floor.
The 404 page: a cradle of 4·0·4 beads, and the 0 keeps losing its thread
The landing on a phone
The map on a phone: labels appear on zoom
The Figma file is one design system with two modes, Wireframe and Hi-Fi, on shared tokens. After the audit I measured every live screen with Playwright and rebuilt what had drifted, down to the network map, which in Figma is the real graph: positions, sizes and colours taken from the live site. Syncing found three real bugs that tests had passed over. Widening countries were never highlighted, because a CSS rule declared later overrode the highlight. The tour dialog drew a focus ring around itself. And phones showed 7 px graph labels: Cytoscape rounds the zoom up to a power of two before deciding whether a label is too small.
Batch-first: every expensive computation happens in the ETL, so the API is read-only and costs €0
The most important architectural decision is invisible to users: all computation — graph metrics, entity matching, scoring, embeddings, AI briefs — happens in a weekly batch job. The production API is a thin read layer over precomputed Postgres tables, with no LLM call on the request path. It runs as a single Docker container on an existing Coolify/Hetzner host, with the weekly ETL as an in-process scheduler, so the marginal cost is €0.
The hardest engineering problem was entity matching between CORDIS and OpenAlex: no shared identifier, only names and countries. The pipeline blocks by country first, which drops the match space by about 95%, then runs a rapidfuzz token-set match, and calls the ROR registry only for the 75–90 borderline band. Querying ROR for every organisation, the original design, caused ETL timeouts; running fuzzy first cut ROR calls about a hundredfold. When ROR is down, a topic keeps last week’s data rather than treating errors as rejections.
The briefs depend on free LLM tiers, which retire models without notice. One retirement silently froze the briefs for weeks, so the job now picks a model the provider still offers, falls back to Google Gemini, and fails loudly. Hardening came last: self-hosted fonts so no visitor IP reaches Google, a Content-Security-Policy with no inline styles, rate limits keyed on an address a forged header cannot choose, and Dependabot on every dependency.
The design that timed out, the normalisation that broke the scores, and the numbers I made smaller
The original matching design queried the ROR API for every organisation. It did not merely run slowly, it caused ETL timeouts. The rebuild runs three layers in a deliberate order — country block, fuzzy match, ROR only for the borderline band — and that ordering is why the pipeline completes at all.
The first scoring version divided each signal by the cohort maximum, and it was wrong in a way that only appeared at scale: about 86% of institutions fell below 30, so the shortlist stopped telling apart the institutions a researcher actually chooses between. Percentile rank within the topic replaced it. A scoring model is not finished when the formula looks sensible, only when its output distribution is useful for the decision.
Most fixes in the later rounds made the product say less. Unconfirmed name matches no longer count, so EU project counts drop by about half. A project counts as on-topic only with a topic keyword in its title or two in its summary, after one stray word pulled a VR-for-film project into Climate adaptation. “Data as of” counts full data runs only, not a refreshed brief. Each change made a number smaller and easier to defend.
Live, measured, honest about limits
As of October 2026: six research topics live, 8,400+ scored institutions, 740,000+ collaboration links. axe WCAG 2.2 AA reports 0 violations on 24 screens, on desktop and on a phone, with no horizontal scroll from 320 to 2560 px. Marginal infrastructure cost: €0. Build time: November 2025 to the May 2026 MVP, then the consortium workflow, the redesign as noda and the design audit in October 2026, all solo.
What I would do differently: validate matching accuracy earlier. I built the full pipeline before measuring its precision; a two-day spike on 200 CORDIS organisations would have surfaced the problem weeks sooner. And look at the product as a designer earlier, not after the tests pass: the bugs that mattered most this year were the ones only a person looking at the screen could see.
The hard part was never the interface. It was making every number on screen something I could defend line by line
Sources
- Blondel, Guillaume, Lambiotte & Lefebvre (2008). Fast unfolding of communities in large networks (Louvain). J. Stat. Mech. P10008.
- Freeman (1977). A set of measures of centrality based on betweenness. Sociometry 40(1):35–41.
- Priem, Piwowar & Orr (2022). OpenAlex: a fully open index of scholarly works, authors, venues, institutions and concepts.
- ROR — Research Organization Registry.
- Reimers & Gurevych (2019). Sentence-BERT: sentence embeddings using Siamese BERT-networks.
