UK & EU Digital Procurement Radar
SVP’s team spent ~4 hours a week manually scanning UK and EU tender portals — and EU coverage was effectively zero. I built a custom dashboard that aggregates, normalises, and relevance-scores procurement notices from UK FTS and EU TED, cutting monitoring time from 4 hours to 45 minutes a week while surfacing the cross-border opportunities that had been invisible
- Problem — SVP’s team spent ~4 hrs/week tab-hopping UK + EU tender portals; EU coverage was near-zero across TED’s 24 languages
- Insight — A retrospective audit found 23 relevant tenders (3 EU) missed in 6 months, against £393bn UK + €2tn EU annual spend
- Solution — I built the Radar solo end-to-end: one dashboard normalising UK FTS + EU TED into a 5-component, 0–100 relevance feed (9,454 CPV codes)
- Outcome — Live since 19 Dec 2025: monitoring −81% (4 hrs → 45 min), qualify-a-tender −83% (15 → 2.5 min), 0 relevant missed, 170/170 tests, £0 hosting
The opportunities existed. SVP simply had no reliable way to see them
Public procurement is a meaningful part of SVP’s pipeline — European governments regularly commission AI strategy work, digital transformation programmes, and advisory services. But the firm’s monitoring process was a loose collection of habits: one or two people opening FTS, Contracts Finder, and TED in separate browser tabs several times a week. This consumed roughly 4 hours of senior time per week.
EU coverage was the worst gap. TED publishes notices in 24 languages across all member states — including Belgium, the Netherlands, and Germany, all markets SVP actively pursues — but no one on the team reviewed it regularly. When I ran a retrospective audit of six months of notices filtered against SVP’s CPV categories, I found 23 relevant tenders that met the firm’s criteria and fell within a realistic response window. None had been actioned. Three were EU-sourced. All three had been missed entirely.
The pain isn’t that relevant tenders don’t exist — the UK and EU procurement markets represent over £393 billion and €2 trillion in annual spend. The pain is having no reliable way to see them
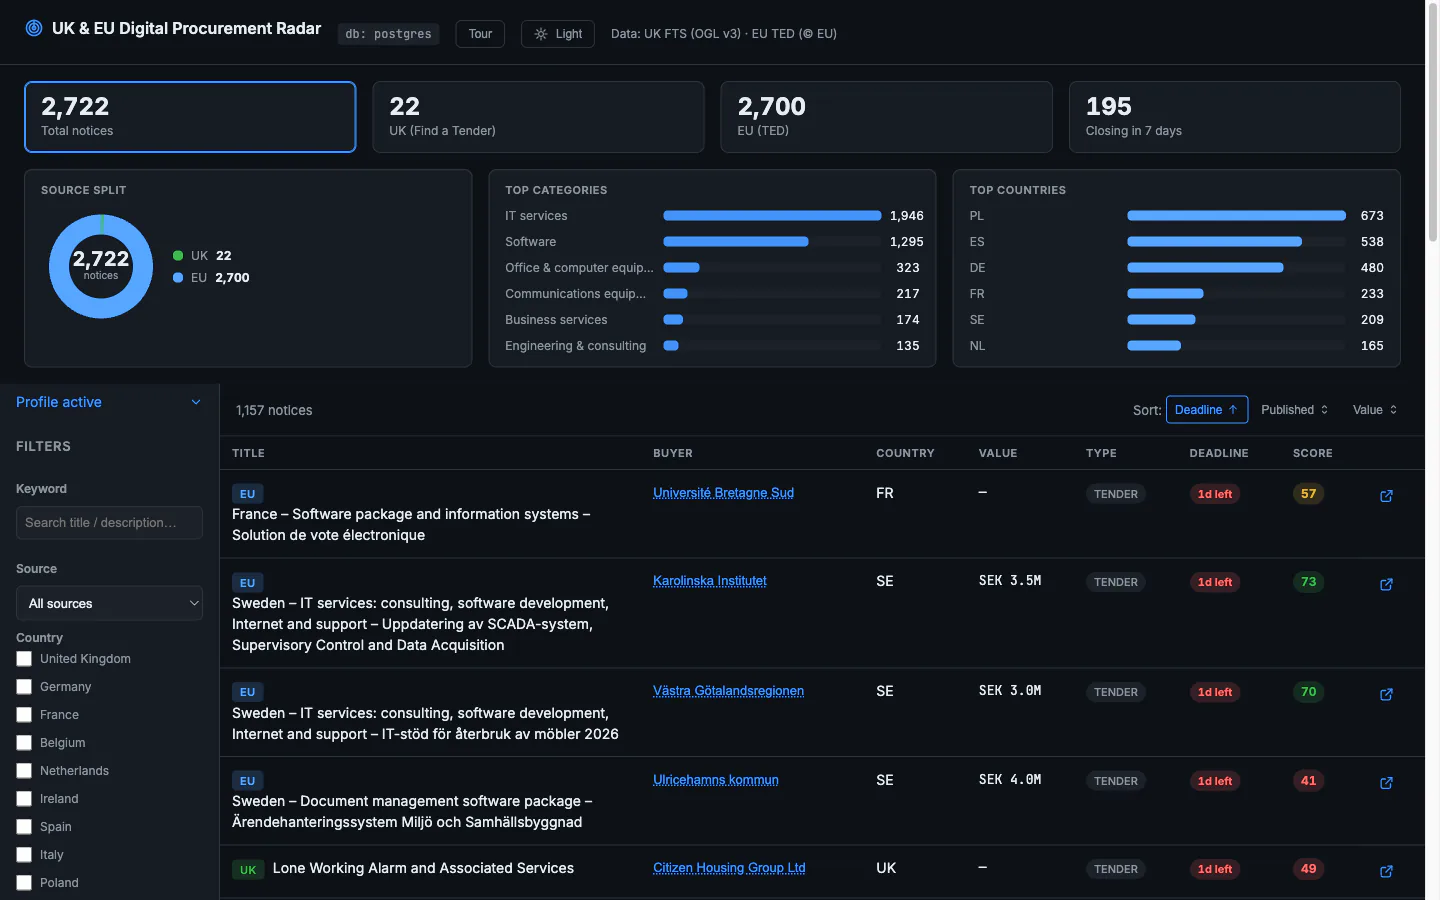
The finished dashboard: stat cards, a source-split donut, and a table ranked by composite relevance score
Discovery before code: five methods, one decisive artefact
Discovery ran September–October 2025. I used five methods: a self-audit of six months of FTS + TED notices against SVP’s service profile; 30-minute semi-structured interviews with four of five team members (CEO, AI engineer, junior specialist, HR); regulatory and API documentation review (UK Procurement Act 2023, FTS OCDS 1.1.5, EU eForms v3); walk-throughs of five competitor tools (Stotles, Tracker Intelligence, BiP Solutions, Tenders Direct, Proactis); and a quantitative review of the Jorpex 2025 procurement monitoring benchmark.
The retrospective audit was the single most persuasive artefact. Surfacing 23 missed notices — including the first EU-sourced tenders SVP had ever evaluated — made the build decision easy. Team interviews confirmed the pattern: the CEO estimated 4 hours per week but acknowledged “most of that is probably wasted on things that aren’t relevant.” The AI engineer had stopped checking TED because “the interface is exhausting.” Every mature competitor was priced for large bid teams, at £3,000–£18,000 per year — a clear gap at the small-firm end.
Competitor tools are priced and designed for bid teams, not five-person consultancies. Cross-border, relevance-scored monitoring at near-zero cost didn’t exist as a product
One surface: aggregate, normalise, score, explain
The Radar ingests UK FTS (OCDS 1.1.5) and EU TED v3 (eForms, 12 countries) on a weekly automated schedule, normalises both into a single canonical schema, and scores every notice against a configurable supplier profile. Normalisation consumed about 40% of the total build — OCDS and eForms have fundamentally different field structures, different field completeness guarantees, and different CPV treatments. A unified ID scheme (`UK:xxx` / `EU:xxx`) prevents cross-source collisions and makes the data source visible in logs and the UI.
The relevance scorer uses five weighted components: CPV code match (35%), keyword match (25%), value range fit (15%), deadline proximity (15%), and buyer behaviour (10%). Each component contributes a plain-language reason — turning an opaque 0–100 number into a qualification argument. Score bands: Strong ≥ 70, Good ≥ 55, Weak < 55. The scorer agreed with expert manual ranking in over 90% of sampled cases during beta.
Live — tenderhub.ontwrpn.com
Opportunity drawer: all structured fields in one place, no portal navigation needed
Explainable scoring: each sub-score comes with a reason, not just a number
Buyer panel: organisation history without leaving the page
Profile configuration: changes recalibrate scores across the entire active notice set
Information architecture for a qualification workflow, not a browse experience
The friction heatmap from the journey map was the design brief. Weekly review dropped from friction 9 to 2; tender qualification from 8 to 3. Every IA decision traced back to those two stages. Stat cards double as quick-filters — clicking “closing soon” instantly narrows the table, so the highest-urgency notices are one tap from the landing state. The filter panel surfaces facet counts for the current filter state, so users can see what’s available before committing to a filter. CPV codes are translated across all 9,454 codes — `72000000-5` becomes “IT services” — accessible to non-procurement specialists, which describes everyone at SVP.
Light and dark themes follow the OS with a manual toggle; a “waking up” progress indicator manages the first-load experience on a warm always-on server rather than leaving users with a blank screen. The layout is fully responsive.
Light theme
Mobile: closing-soon notices reviewable on the go
Five months in production. All measurable targets met
The tool launched on 19 December 2025 and has run continuously with automated weekly ingestion. Five months of production data (Dec 2025 – May 2026), validated at a March 2026 impact review: weekly BD monitoring time 4 hrs → 45 min (−81%); time to qualify one tender ~15 min → ~2.5 min (−83%); EU tenders surfaced per week 0 → avg 12 relevant notices; tools open simultaneously 3–4 → 1; relevant tenders missed at score ≥ 70 ~4/month → 0; 170/170 backend tests passing; ~7,860 notices under automated management at a failed-row rate of 0%; £0 marginal hosting cost.
First EU-sourced tenders shortlisted for bid within weeks of launch. Conservative unit economics: time savings alone recover the ~£6,400 build cost in approximately 6.6 months; including pipeline attribution, payback shortens to ~3.9 months. The commercially critical metric — pipeline conversion across a full bid cycle — is still accumulating. Honest read: that’s the number that will matter at the 12-month mark.
Normalisation consumed ~40% of total build hours. In future dual-source builds, a normalisation spike belongs in discovery, not alpha